What if it was you?
The other times it sat here, and what a buy would have done.
Chapter 4 · Days like today
What happened the other times it sat here?
Every day, on one chart.
Guess its band first. Then scrub to any day and see its price, its band, and the year that came next.
Every number below comes from real daily prices.
What if you'd bought?
Pick a day and a sum. Guess first: up, or down?
Reading the prices…
That is the past. Not a promise. Spread the buys out instead? See what a little each week did.
How to read this chart
The bands are a ruler, not a road. Bitcoin has sat in every band, and it has fallen hard from high bands and mid bands alike.
A model, not prophecy. This line shows the past. It does not know the future. No one does. Past prices never promise future ones.
Where this chart comes from. The rainbow is a public chart: azop drew the first one in 2014, on trolololo's growth line. Blockchain Center made it famous. The line here is our own fit, on the same public prices.
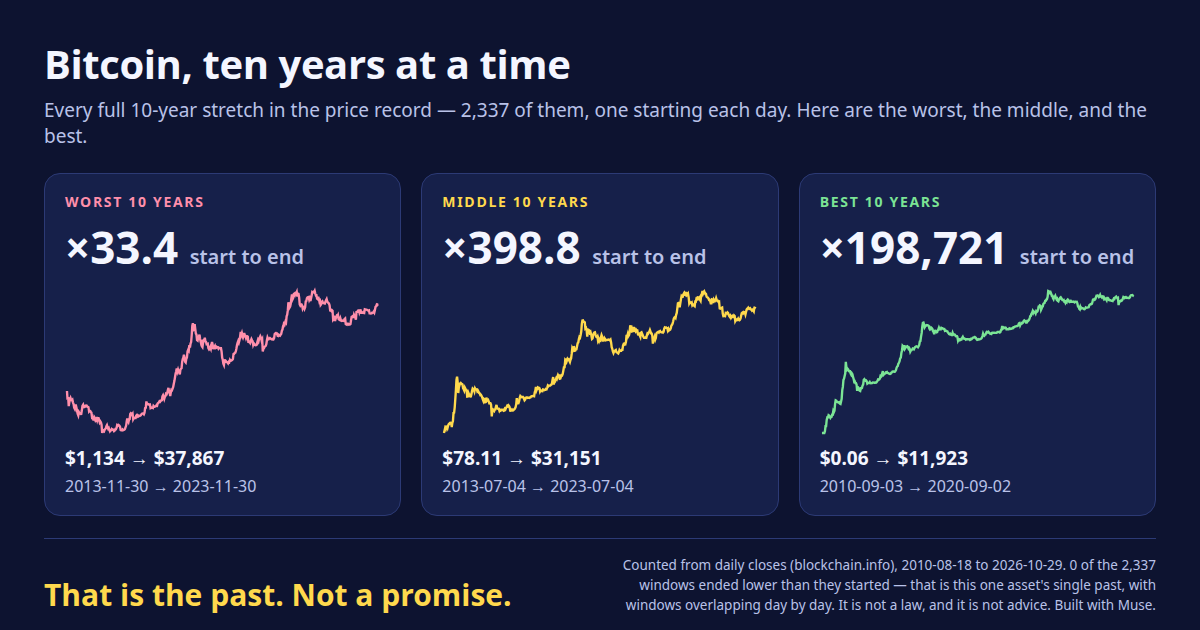
Ten years at a time: the worst path, the middle path, and the best.
A little, every week.
Like an allowance, in reverse.
1. Pick an amount. It goes in each week.
2. Pick a span. One, three, or five years.
3. See the past.
You would have put in …
It would be worth … today.
That is the past. Not a promise.
Past prices: blockchain.info. Live price: Coinbase.