The Bitcoin Rainbow in plain words.
Sixteen years of climbs and crashes, in words anyone can read.
Start hereRather ask in your own words? Ask here.
Step 1
What bitcoin is.
Bitcoin is money for the internet. No company runs it. No boss can print more. Only 21 million will ever exist. It lives on many computers at once. You can own a whole coin, or a small piece.
Step 2
Where are we now?
It is a growth chart for bitcoin's price. Through the middle runs one line: bitcoin's long-run growth, fit to every daily price on record. The chart is drawn in percents, not dollars. A jump from $1 to $2 takes the same space as a jump from $50,000 to $100,000, so the whole history fits on one page. Around the line stack nine colored bands, Deep Blue at the bottom, Red at the top. The low bands mean the price sits far under its own past growth. The high bands mean far over it. A Reddit user, azop, drew the first rainbow in 2014, on a growth line by trolololo, a forum user. Blockchain Center made the chart famous. The line here is our own fit of the same public prices. That is the past. Not a promise.
One moment. We are reading the chart.
Touch the chart.
Drag across the rainbow. Any day since 2010: its price, its band, how far from the line it sat, and the year that came next.
What the colors mean.
Tap a color on the chart, or a band in the list. Each band tells you three things: how far from the line it sits, how many days the price has lived there, and what the year after past visits did.
So, does this mean buy?
No. The chart shows where the price sits inside its own past pattern. It cannot say buy, and it cannot say skip. No chart can.
What it can do is show what happened the other times the price sat where it sits now. That is the band panel above, and the day scrubber under the chart.
Want to talk it through in your own words? Ask: should I buy bitcoin now? This is learning, not financial advice.
Every day, on one chart.
Drag on the chart, or use the slider. Pick any day. See its price and its band. See the year that came next.
Every number below comes from real daily closes.
The big falls.
Each fall is measured from the data.
| Fall | Top | Bottom | Drop | Back to the top |
|---|
How to read this chart.
The bands are a ruler, not a road. Bitcoin has sat in every band. It fell hard from high bands. It fell hard from mid bands too.
A model, not prophecy. This line shows the past. It does not know the future. No one does. Past prices never promise future ones.
Where this chart comes from. The rainbow is a public chart. A Reddit user, azop, drew the first one in 2014. A forum user, trolololo, drew the growth line. Blockchain Center made the chart famous. The line here is our own fit. It uses the same public price history.
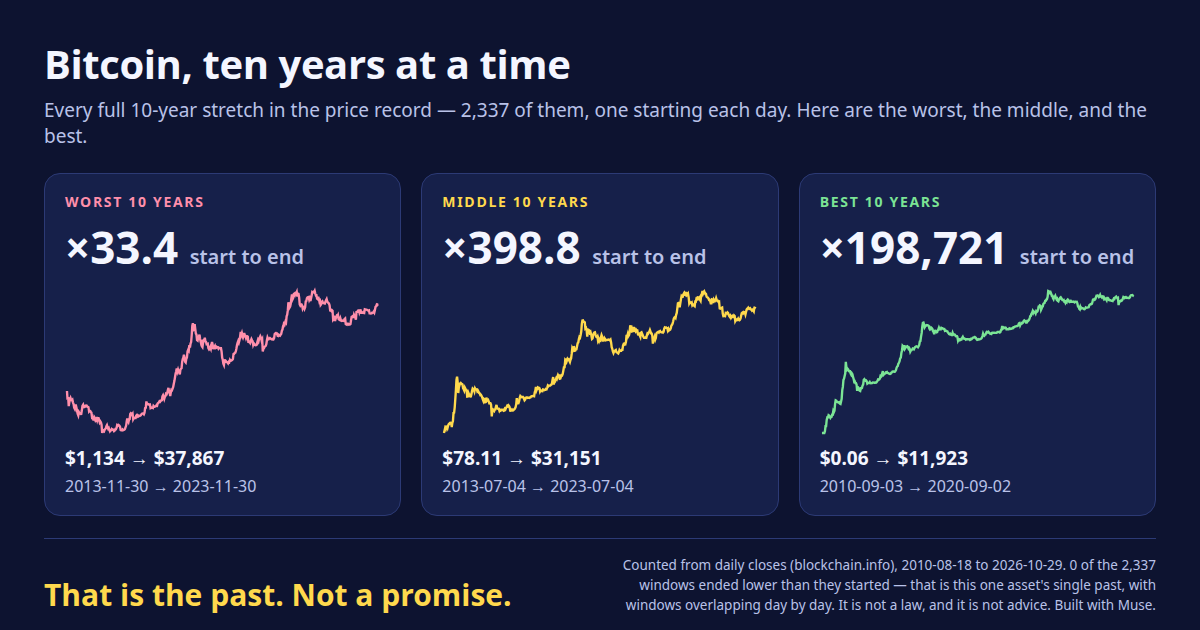
That is the past. Not a promise.
Step 3
Why we think it climbs on. A belief, not a fact.
Its line climbs for 16 years. It fell hard, many times. It climbed back each time. Pick any start day. Four years on, the price stood higher. Every time, so far.
Why might it go on? Only 21 million will ever exist. Most are already out. New coins come slower every four years. The last cut was in 2024. Big funds sell it in stock accounts. That is the case: a belief, not a fact. This is learning, not financial advice.
Step 4
A little, every week.
Like an allowance, in reverse. A little, every week.
1. Pick an amount. It goes in each week.
2. Pick a span. One, three, or five years.
3. See the past.
You would have put in …
It would be worth … today.
That is the past. Not a promise.
Past prices: blockchain.info. Live price: Coinbase.
Step 5
It swings hard. We could be wrong.
Since 2011, it fell by half or more. Seven times. In 2022, it fell by about three fourths. It can do that again. A total loss should sting, not sink you.
It could fall and stay down. New laws could hurt it. The climb is a pattern, not a law. Many fans keep 5 to 10 in 100 saved. The bold end is 10 to 20 in 100. Only money you will not need for years. This is learning, not financial advice.
Step 6
The two ways people hold it.
IBIT
In a stock account, like a stock. You do not hold the coins.
Exchange app
You hold real bitcoin. You keep the keys.
Fees
Both charge fees. IBIT: yearly. Apps: per buy.
Step 7
Learn the words.
Price
…
Price is the tag at the store.
Technical
Watching the line.
Fundamental
Fundamental is a health check.